Why Most Multifamily Underwriting Models Are Broken (and How to Fix It)
Most acquisitions teams rebuild the same Excel model for every deal — and every deal arrives with broken formulas, drifted assumptions, and recipients who can't read it. There's a better way: engine in code, Sheet as the rendering layer, the build automated, and the whole pipeline wrapped in a skill so the next deal takes 15 minutes.

Field Notes #006 — Most acquisitions teams accept that every deal means rebuilding the same Excel model from scratch. They hire analysts to grind through it. The analyst spends roughly 60% of their time rebuilding and 40% actually thinking. This is about flipping that ratio — and the architecture that makes it possible. — Dakota
Open any institutional acquisitions team’s Drive folder. You’ll find the same pattern: one Excel template that gets duplicated for every new deal, modified in flight, drift accumulating with each iteration, hardcoded values everywhere, and a long tail of broken models that nobody trusts anymore.
This is the industry’s worst-kept secret. The pro formas you send to LPs, lenders, and partners are held together by glue. One paste-special value in the wrong cell can throw your IRR off by 300 basis points. You won’t notice until somebody asks a question you can’t answer.
There’s a better way. Here’s how to build one.
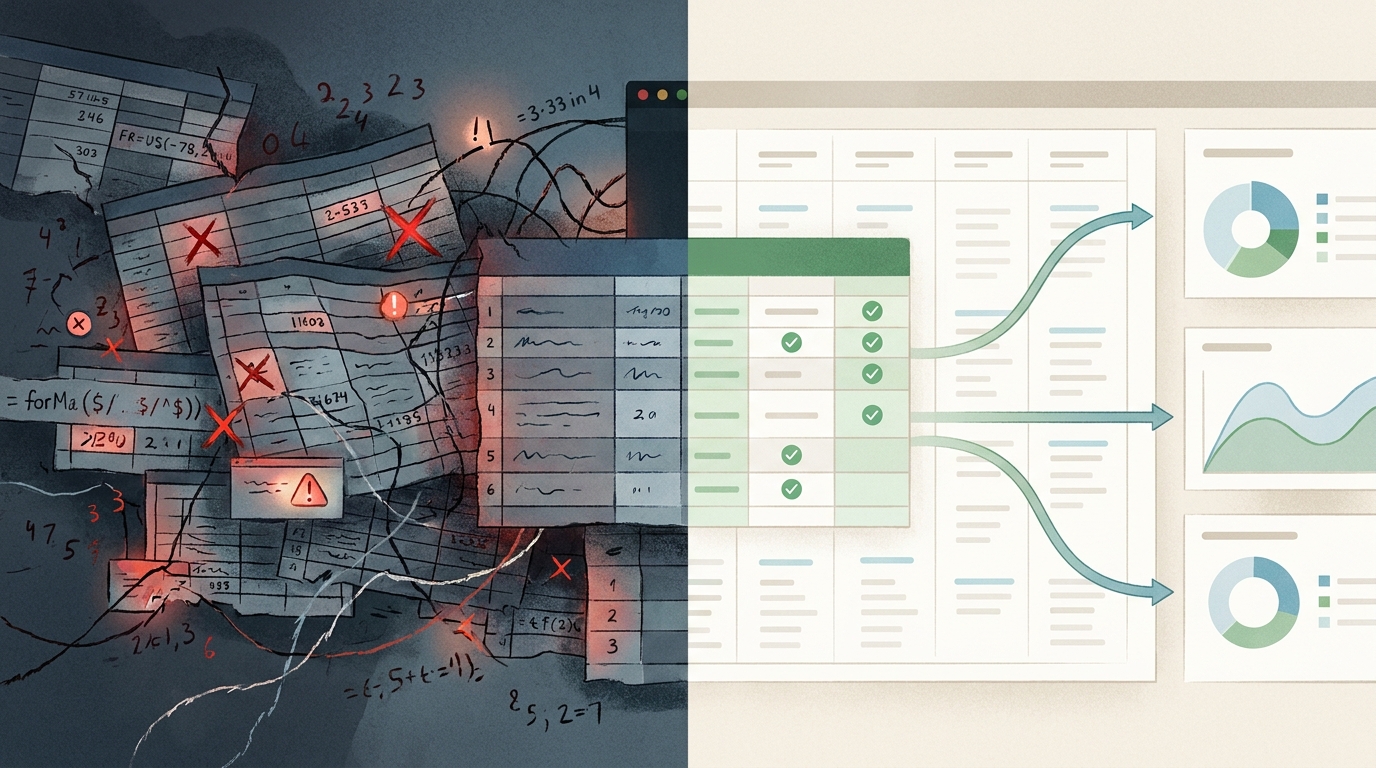
The five failures of typical UW workbooks
Before fixing anything, it helps to name what’s broken.
Broker pro formas are biased by design. Brokers earn commission. Their pro forma exists to make the deal look good at their asking price. The lease-up curve is optimistic, the bad-debt assumption is often zero, on-site payroll is sometimes literally zero on a 63-unit building, and the rent growth between Year 3 and Year 10 mysteriously exceeds whatever rent growth input they claim to be using. Their job is to maximize the price. Your job — as the buyer — is to rebuild on your own conservative assumptions.
Excel rebuilds drift. You start with a clean template. By Day 3, you’ve hardcoded a number because you were in a hurry. By Day 7, you’ve forgotten what you hardcoded. By Day 14, you change an assumption and only half the workbook updates — the other half is stuck at stale values. The model still “works” in the sense that it produces numbers. But the numbers are wrong, and the worst part is you can’t tell which ones.
Recipients can’t read it. You send the broker a 12-tab Excel file. They open the Assumptions tab first, see 70 rows of yellow cells, and bounce. Or — worse — they edit a cell because they think they should fill it in, and now your formulas are broken.
No version control. You make a change at 2 AM, you forget what you changed, you can’t go back, you can’t tell a partner what’s different between v1 and v3. Comments and revision history in Sheets help marginally but don’t solve the problem.
Every deal is a one-off. You do all this work, then you do it again for the next deal. And again. Every deal is a one-off Excel file that drifts. The team’s energy goes into rebuilding the same model — not into thinking about which deals actually pencil.
The four principles that fix it
The architecture that solves these problems isn’t novel. It’s just good engineering applied to financial modeling.
Principle 1: Every cell is either an INPUT or a CALCULATION.
This is the foundational discipline. If you can’t trace every numeric cell in your model back to a specific input, the model is broken.
A “calculation” can be a Sheet formula (= input1 * input2 / input3) or it can be an output from a pre-computed engine (e.g., a Python function that runs amortization and writes the year-by-year balance into cells). Either is fine — as long as the cell isn’t a paste-special value masquerading as a calculation.
Enforcing this discipline requires multiple audit passes. The first pass catches the obvious hardcoded values — purchase price, NOI, loan amount. The second pass catches the subtle ones — that 1.02 multiplier sitting in a formula representing 2% growth should be a named range. The third pass catches the ones you missed.
In one recent build, we eliminated roughly 40 hardcoded values over three audit passes. Each one was a silent bug waiting to surface.
Principle 2: The math lives in code, not in Sheets.
The Sheet is the rendering layer. The Sheet is what you send to recipients. But the Sheet should NOT be where the math lives.
The math lives in a pure-Python engine that:
- Computes NOI year by year
- Handles monthly debt amortization (interest-only periods, refi mid-stream)
- Solves IRR via Newton-Raphson with bisection fallback
- Splits the LP/GP waterfall by preferred return and promote tiers
The engine has zero dependencies on Google Sheets. It runs in 30 milliseconds. It has 33 unit tests, each written before the function it tests.
This separation between engine and presentation is the single biggest architectural choice in the build. Get it right and everything else gets easier.
Principle 3: Recipients first.
The person opening your Sheet should know within 30 seconds:
- What is this property?
- What is the deal status?
- What are the headline numbers?
- What’s the verdict?
- What do they do next?
If they don’t know these things within 30 seconds, your model has a UX problem. Fix it before you fix any math.
The solution is a Cover tab at position 0 that lands recipients on property name, address, deal status, key parties, source documents, live headline metrics, a 2-sentence verdict (formula-driven, never stale), and navigation instructions.
A recipient lands, spends 30 seconds, and either keeps reading or forwards it to the right person. The Cover doesn’t replace the Deal Summary tab — it precedes it.
Principle 4: The build is automated.
A pipeline that requires manual copy-paste, manual edits, manual uploads is a pipeline that will drift. Manual steps are where errors hide.
The right architecture: three commands, sixty seconds, end-to-end.
- Build — Python engine produces the projection, builder writes the xlsx
- Upload — xlsx pushed to Google Drive, auto-converted to a native Sheet
- Verify — 11 tie-out checks (live Sheet cells match engine to the cent), plus formula error scan, plus cross-tab consistency checks
If any check fails, the build is broken and you don’t ship. The verification harness is the safety net that makes financial software you can trust.
The architecture
Three layers, each with a single responsibility:
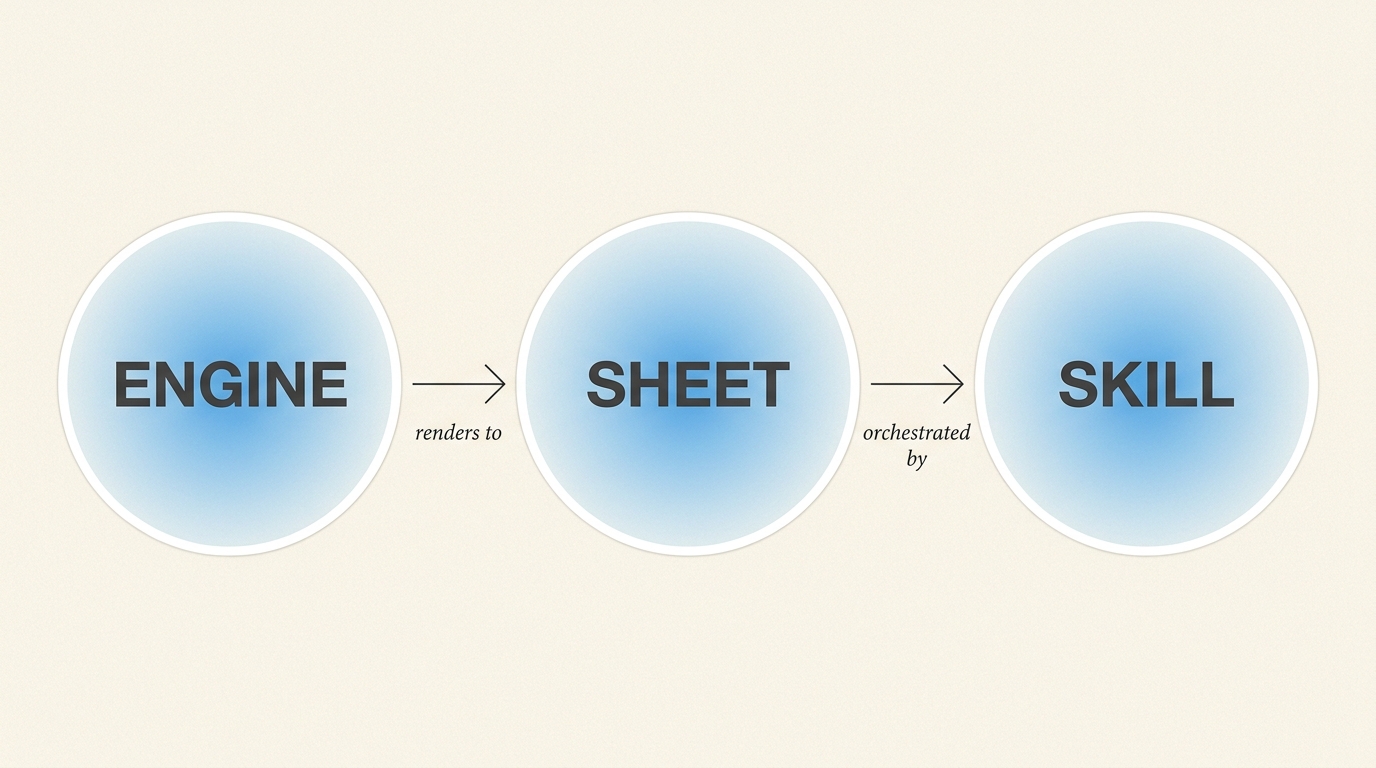
ENGINE — Pure-Python financial logic. Computes NOI, debt service, refi sizing, IRR, waterfall. 33 unit tests, all TDD. Standard library only. The canonical truth — everything downstream references it.
SHEET — 13-tab Google Sheet generated by openpyxl. ~300 named ranges, formula-driven everywhere possible. The engine’s output is rendered to specific cells; everything else is a Sheet formula referencing named ranges. Yellow cells = editable inputs. Gray cells = engine outputs (read-only). White cells with no fill = live formulas. Color is the propagation contract.
SKILL — Orchestration layer. One markdown file tells an AI assistant how to invoke the pipeline. One environment variable threads through engine + builder + uploader + verifier. The next deal is a 15-minute invocation, not a six-hour rebuild.
The architectural payoff: when the model itself needs changes — a new tab, a fixed formula, a different default — you edit the engine code. The next deal automatically inherits. There’s no template-copying logic, no Sheet-cloning, no drift between deals.
The decisions that mattered most
A handful of architectural choices had outsized impact on the final product.
Refinance at Year 4, not Year 2. The first build refinanced the bridge loan at end of Year 2 — standard value-add timing. The broker’s workbook refinanced at end of Year 4. We initially thought Year 2 was conservative. We were wrong. By Year 4, the property has a full year of stabilized operating history. The lender appraises off Year-4 trailing NOI plus a forward projection. The result is a meaningfully larger refi loan than what Year 2 supports. Switching to Year-4 refi (with our tightened sizing constraints) made our model directly comparable to the broker’s. Any remaining gap is now explained entirely by defensible assumption differences, not by timing games. The lesson: when negotiating with a broker, make sure your delta is in things you can defend.
Split Cash-on-Cash into two methods. The single “Average Cash-on-Cash” metric is misleading. Two industry conventions exist — Operating CoC (pure operating yield, what OMs report) and Total Return on Remaining Capital (basis decreases when capital is returned via refi, not from operating distributions — what value-add operators actually think about). We compute both. Recipients see the full picture instead of a single number that hides structure.
Hide engine internals. Rename “Realtor Variance” to “Diligence Questions.” Engine outputs (per-year ramps, monthly amort) have to live on a tab somewhere. But recipients don’t need to see them. They look like inputs but they’re not editable. Showing them creates confusion. So the tab is programmatically hidden by default; power users can unhide via the menu. The Realtor Variance tab had a similar problem — the questions read as adversarial talking points. We renamed and reworded each question from accusatory to neutral. Same intent, professional tone, safe to share externally.
A propagation guide on the Assumptions tab. A subtle frustration: change an assumption and some downstream metrics update while others silently don’t. Reason: some cells are LIVE formulas. Others are ENGINE OUTPUTS computed at build time. Both look similar; the propagation behavior is invisible. Fix: every input row gets a note tagged either ”✓ LIVE — drives X” or ”⚠ REBUILD: requires engine rebuild.” The user sees the warning before they make the change. Documentation as UX. Every confusing behavior gets a note that explains itself.
The skill abstraction
The final layer is what turns a one-off build into a system.
A skill — in this context, a Claude Code construct — is a markdown file that tells an AI assistant how to do a job. It contains trigger phrases, required inputs (Tier 1 — cannot run without these), preferred inputs (Tier 2 — defaults applied if missing, flagged as estimated), house defaults (Tier 3 — standing assumptions when nothing else is specified), and a step-by-step workflow.
When a new deal comes in:
- The AI reads the skill definition and recognizes the request
- The AI extracts structured data from the OM PDF, T12, rent roll
- The AI identifies gaps and either asks the user OR applies house defaults
- The AI generates the fixture JSON files
- The AI sets one environment variable and runs the pipeline
- The AI verifies the output and reports the URL plus headline metrics
The architectural payoff: when the underwriting model itself needs changes, you edit the engine. The next deal automatically inherits. No template-copying. No drift.
The first deal takes hours because you’re building the engine. The hundredth deal takes minutes because you’re invoking it.
What it looks like in practice
A worked example: a 63-unit value-add multifamily target in a tertiary South Dakota market. Broker asking $4.8M with a stated levered IRR of approximately 10.3% and a 2.20× equity multiple.
Rebuilt on conservative assumptions at a $4.4M counter price:
- Year 1 NOI: $306,420 (vs broker’s stated $382,503)
- Year 3 Stabilized NOI: $448,313 (vs broker’s stated $524,900)
- Refi Loan Supported at Year 4: $4.36M (vs broker’s stated $6.28M)
- Refi Cash-out: ~$651k
- Levered IRR (10-yr): 15.69%
- LP IRR (10-yr): 13.74% (beats broker’s stated 13.03%)
- Equity Multiple: 3.04× (vs broker’s stated 2.20×)
Counter-intuitive: this model produces better returns than the broker’s pro forma despite more conservative operating assumptions throughout. Lower NOI, higher bad debt, real on-site payroll, post-sale tax reassessment, conservative growth.
How is that possible? Two reasons.
Lower basis. $4.4M vs $4.8M is $400k of equity gain at any exit cap. Basis is the single biggest lever in any value-add UW.
Structural timing alignment. Year-4 refi captures three full years of operating maturity in the appraised value. With cheaper but defensible debt assumptions, the cash-out covers a meaningful return of capital — which compounds heavily in IRR because cash returned earlier is more valuable.
No magic. Just disciplined math on a defensible basis.
What generalizes beyond multifamily
The pattern — engine in code, presentation in Sheets, build automated, verification automatic, wrapped in a skill — applies to storage facility underwriting, single-family wholesale lead scoring, insurance loss-runs analysis, construction cost estimating, property tax appeals, LP quarterly reporting, lender package preparation. Any deal-by-deal analytical workflow.
The principles don’t depend on AI assistance. They’re good engineering. AI tooling just makes them faster to implement.
How to build your version
A minimal path, week by week:
Week 1. Build the engine in Python. Write financial primitives — PMT, IRR, amortize, equity multiple. Write a load function that reads inputs from JSON. Write a projection function that produces 10 years of NOI/OpEx/DS. Write unit tests for each primitive. Run on a past deal as a known-good fixture.
Week 2. Build one tab. Use openpyxl to write a “Deal Summary” tab with the engine’s output. Define named ranges. Upload as a Google Sheet via the Drive API. Write a verification script that reads live cells and asserts they match the engine.
Week 3. Add the other tabs. Assumptions, 10-Year Cash Flow, Returns & Waterfall, Sources & Uses. Wire formulas to named ranges.
Week 4. Polish. Add a Cover tab. Add Diligence Questions. Add Sensitivity Analysis. Color-code: yellow inputs, gray engine outputs, white formulas. Hide engine internals.
Week 5. Wrap in a skill. Document the inputs (Tier 1 required, Tier 2 preferred, Tier 3 house defaults). Write a fixture template. Test end-to-end on a new deal.
By the end of Week 5, you have a working underwriting pipeline. The sixth week onward is refinement based on what the actual workflow surfaces.
With AI-assisted development the timeline compresses significantly — most of the work is tedious openpyxl formatting, named-range bookkeeping, and tab-by-tab layout that an AI can grind through quickly.
The bottom line
Most acquisitions teams treat each deal as a one-off modeling exercise. They rebuild the same spreadsheet from scratch, spend most of their analyst time on bookkeeping rather than thinking, and end up with bloated Excel files that drift and break.
There’s a better way:
- Engine in Python (testable, reproducible, fast)
- Sheet as the rendering layer (what you send to recipients)
- Build automated (3 commands, 60 seconds)
- Verification automatic (TDD + tie checks + audit)
- Wrapped in a skill (next deal in minutes, not hours)
The math itself isn’t novel. Multifamily underwriting is a well-understood discipline. What’s novel here is the engineering rigor applied to it.
The deals that pencil aren’t the deals you find. They’re the deals you can move fast on. A pipeline that lets you go from “broker sent me an OM” to “I have a defensible counter-offer with diligence questions ready” in fifteen minutes is a competitive moat.
Your deal-by-deal analytical work doesn’t have to be manual. Engine = code. Presentation = Sheets. Build = automated. Next instance = a skill invocation, not a fresh start.
— Dakota